


You're standing in front of two very different charts and they're both calling themselves a concentration ratio. One might be a bottle label for a cleaning liquid you need to dilute before use, the other a market-share table that looks like antitrust homework you didn't ask for. The good news is that once you separate those two meanings, the math gets much easier, and the next bottle or chart you see won't feel like a trap.
Why Two Different Things Share the Same Name
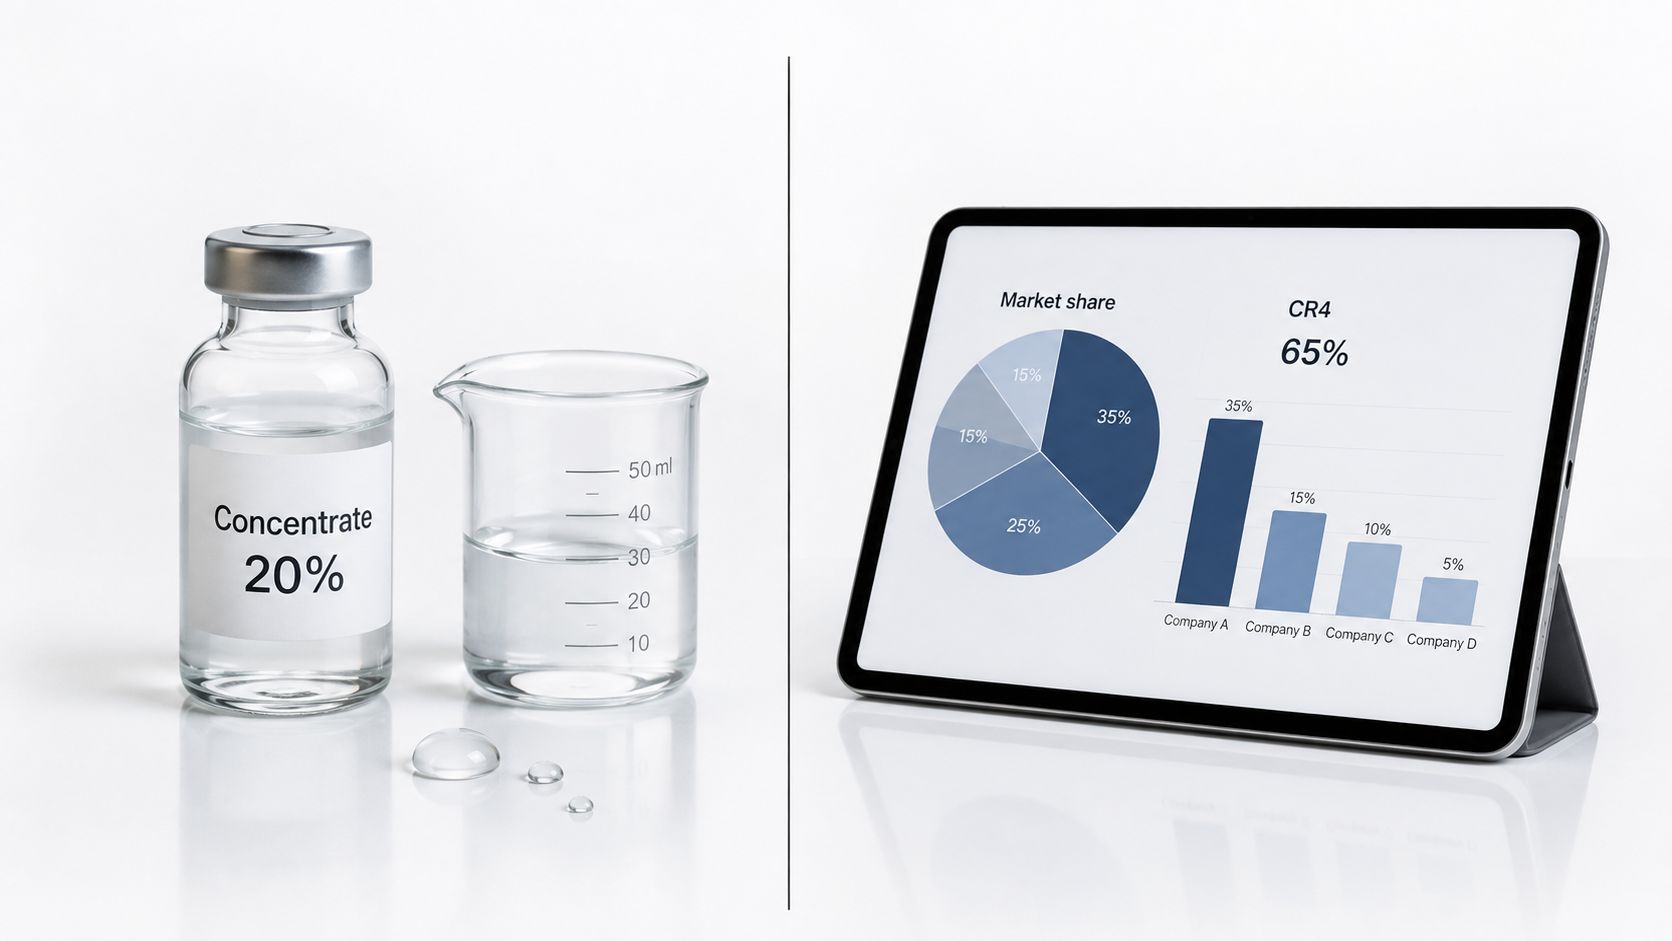
A kitchen counter, a workshop bench, and a policy brief can all hide the same source of confusion. One reader is staring at a concentrate for an ultrasonic jewelry cleaner, wondering how much water to add. Another is looking at a chart of firm shares and trying to tell whether CR4 means healthy competition or something closer to a bottleneck.
The chemistry version feels physical
In liquids, a concentration ratio tells you how much active ingredient sits inside a solution compared with the whole mix. You might see it written as a fraction, a percentage, or a simple ratio like 1:10. That language matters because a cleaner, a cutting fluid, and a wound cleanser all behave differently once they're diluted.
A small change in the mix can change residue, contact time, and how safe the liquid is on a surface. That is why people often keep the bottle in front of them while they do the math. They are not trying to be academic, they are trying not to waste product or damage a ring, a tool, or a countertop.
The economics version feels structural
In markets, concentration ratios mean something else entirely. The most common version is CR4, which is the combined market share of the largest four firms in an industry. The same logic extends to CR8, which adds the top eight firms, and to HHI, which looks at the full spread of firm sizes rather than just the top group.
That market version is the one used in antitrust and industry analysis. The meaning depends on how the market is defined and on whether analysts use establishment-level or firm-level data, so the same industry can look different depending on the lens.
Defining Concentration Ratios Across Contexts
A bottle label and an industry chart can use the same words while pointing to very different things. In chemistry, a concentration ratio describes how much active material sits inside a larger mix. In economics, the same phrase points to how much of a market is held by a few firms. The shared name causes confusion, but the measurement problem is not the same.
Chemistry uses ratios to describe the make-up of a liquid or solution. If a cleaner is labeled v/v, it means volume compared with volume. If it says w/w, that is weight compared with weight, and w/v means weight measured against a set volume of liquid. The notation is not decorative, it tells you how the parts are being counted so the mixture comes out at the strength you expected.
That matters because the physical form of the ingredients changes how you read the label. If both parts are liquids, v/v is usually the clearest way to think about the mix. If one part is a powder or other solid, w/v or w/w may fit better. The goal stays the same, keep the units aligned so the finished solution matches the intended concentration.
The market meaning uses firm shares instead of liquid parts
Economics borrows the same word but applies it to firm shares. CR4 means adding the market shares of the top four firms. CR8 does the same for the top eight. If those largest firms together control a large share of sales, the market is more concentrated than one made up of many similarly sized competitors.
Practical rule: if the ratio asks about a bottle, think mixture. If it asks about firms, think market structure.
HHI belongs in the same discussion because it shows whether the top firms are evenly matched or whether one dominant company sits far above the rest. Two industries can post the same CR4 and still feel very different in competition because the shape of that top-four group changes the picture. Analysts who want a plain-language look at market shares often use a guide to smarter pricing strategies to make that comparison easier.
A bottle and a market chart both ask the same broad question, how much of the whole is held by a small part of the whole. The answer changes with the setting, but the idea behind the ratio stays familiar.
Calculating Solution Dilutions Step by Step
A dilution problem starts with one simple check, how much of the concentrate do you have, and how much finished liquid do you need? C1V1 = C2V2 answers that in one line. The left side describes the starting mix, and the right side describes the diluted mix. The active ingredient you begin with must equal the active ingredient you end with after water or another solvent is added.
Suppose a concentrate is 20% active ingredient and the working solution should be 2% for ultrasonic jewelry cleaning. If the final batch is 10 ounces, the setup becomes 20% × V1 = 2% × 10 oz. Solving for V1 gives 1 ounce of concentrate, and the remaining 9 ounces are water. That kind of check keeps the bottle from becoming too weak or too strong for the task.
The units have to stay aligned. If the finished batch is measured in ounces, the starting volume needs to be in ounces too. If you switch to milliliters, switch every part of the equation to milliliters. Many mixing errors happen at the measuring cup, not in the algebra.
A lab-style dilution workflow follows the same logic, especially when a small sample must be brought to a new strength without changing the chemistry more than necessary. A clear walk-through of that kind of process is available in dilución de muestras para investigadores.
Typical dilution ranges for common cleaning tasks
| Use Case | Concentrate Strength | Typical Dilution | Working Ratio |
|---|---|---|---|
| Gentle Jewelry Soak | 20% active ingredient | 2% working solution | 1:50 |
| Heavy Degreaser | 20% active ingredient | 5% working solution | 1:20 |
| Light Surface Spray | 20% active ingredient | 1% working solution | 1:100 |
A simple shortcut is the 1-to-N rule. If a label calls for 1 part concentrate to 9 parts water, the working mix is 1:10 by the usual label convention. Read the label closely so you know whether the first part is the concentrate and whether the ratio is written as concentrate-to-water or as total parts.
For product-specific guidance, the dilution notes on the ultrasonic jewelry cleaner solution page show how to read a label before mixing. The math is straightforward, but the label keeps the mixture honest. Measure slowly, and measure the same way each time.
Calculating Market Concentration Ratios Step by Step
A market-share table makes this easier than a textbook does. Suppose six firms hold 28%, 19%, 14%, 11%, 9%, and 7% of a market, with the rest split across smaller players. To calculate CR4, add the top four shares, which gives 72%. To calculate CR8, add the next four largest shares as well, which gives a broader view of how much of the market sits with the leading firms.
That 72% reading sits above the Federal Reserve's threshold language, where concentration below 40% is generally treated as unconcentrated and 80% or above as highly concentrated. The gap matters because a market can be concentrated without being fully dominated. A chart reader needs to know which side of that line they are on, not just that a line exists.
Why the inside of CR4 matters
Two markets can both land at 72% and still feel different. If the top four firms are sized 28%, 19%, 14%, and 11%, rivalry inside the group still exists. If the top four are 60%, 7%, 3%, and 2%, one company is carrying most of the market on its back.
That is why HHI matters. It gives more weight to large firms, so the squaring step makes a lopsided market look more unequal than CR4 alone would. In other words, CR4 tells you how much of the market the leaders control, while HHI shows how concentrated that control is inside the leader group.
A concentration ratio is a useful screen, not a verdict. The structure behind the number is where the meaningful insight lies.
For pricing readers, the market-share lens used in the guide to smarter pricing strategies helps connect concentration to pricing pressure, because pricing moves often follow how shares are distributed, not just the headline number. The formula is short, but the interpretation is not. A good analyst checks the market definition, the spread of shares, and whether the metric is being used as a first look or a final answer.
Real-World Applications With Evo Dyne Products
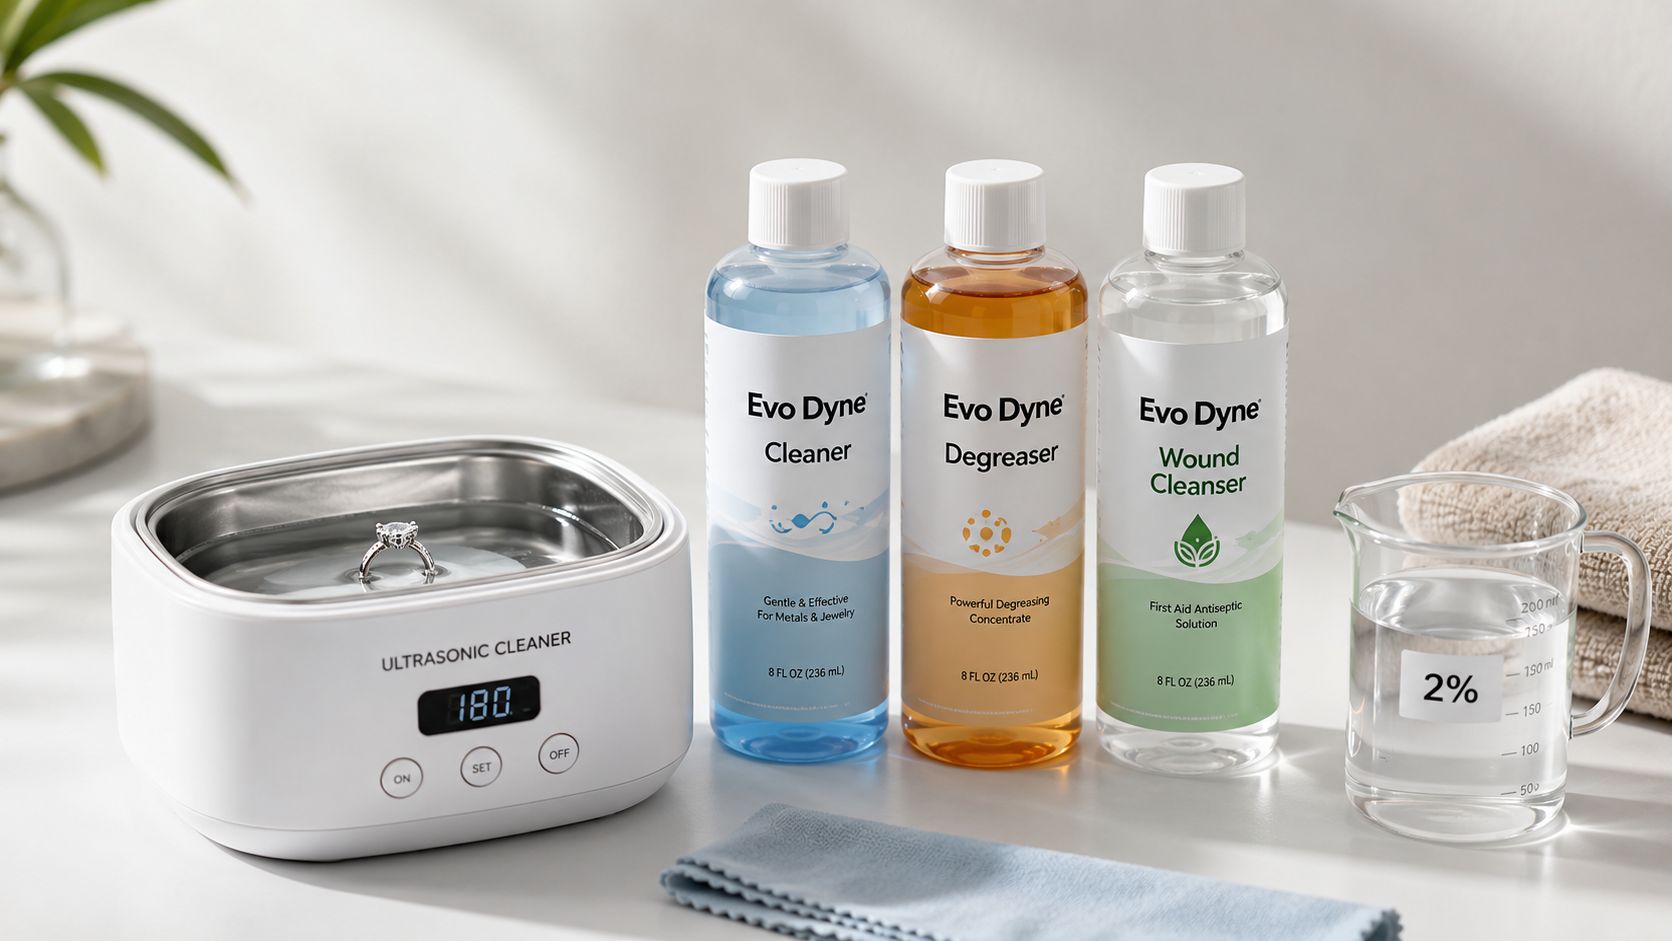
A bottle of ultrasonic jewelry cleaner usually asks for a different working strength than a tool lubricant or a dermal cleanser. The cleaning job is gentler, the surface is delicate, and the goal is to lift residue without leaving a heavy film. That's why fragrance-free soaking solutions tend to sit in the lower working range, while stronger industrial fluids stay closer to stock or only lightly diluted.
The logic is easy to see with cutting and lubrication oils. A machine shop doesn't want a thin, weak film when a tool is under load, so the product is chosen for performance first and dilution second. A dermal wound cleanser sits in a different category again, because the safest design is often a ready-to-use strength that removes the guesswork entirely.
Match the ratio to the job, not to a habit
A lot of people assume one cleaning strength can do everything. That's rarely true. A jewelry soak needs a different balance than a degreasing pass on metal parts, and a consumer health cleanser needs tighter control than either.
The practical test is simple. Ask what the liquid has to do, what surface it touches, and how much margin you need before residue, corrosion, or irritation becomes a problem. Once you answer those three questions, the ratio usually becomes obvious.
If a product is meant to protect a delicate surface, lower working strength often makes more sense than brute-force concentration.
That's why product category matters more than brand hype. An ultrasonic cleaner, a cutting oil, and a dermal cleanser are solved by different concentration choices because their jobs are different. One is about cleaning detail, one is about mechanical performance, and one is about safe, controlled application. When you can read the purpose, you can usually predict the working concentration without needing a chemistry degree.
How to Interpret the Numbers You Get
A concentration number only matters if you know what it changes. In chemistry, a stronger working mix can lift stubborn grime faster, but it can also leave residue or be too aggressive for plated jewelry, soft plastics, or sensitive finishes. A weaker mix is often safer, but it may need more contact time or a second pass.
That is why the number on the label is only half the instruction. The other half is the substrate, the dwell time, and whether the surface can handle repeated exposure. A 2% soak and a 5% degreaser may both be correct, but they are correct for very different tasks.
A lab-style check helps here. If the liquid is meant to clean a delicate surface, the safer interpretation is usually the one that protects the finish first, even if it works more slowly. If the liquid is meant to remove heavy soil from a durable part, a stronger mix may be justified because the surface can tolerate more aggressive action. The same number can be fine in one setting and excessive in another, just as the same rinse strength can be harmless on steel and unwise on a plated component.
The market side needs the same caution
In markets, a CR4 can describe very different competitive realities. A concentration ratio depends on market definition and on whether analysts use establishment-level or firm-level data, so the same industry can look more or less concentrated depending on the unit of observation. That is one reason a single number rarely settles an antitrust question.
The broader reading matters too. Analyses of concentration in the U.S. economy show that average C4 levels can sit near the middle of the range rather than at an extreme, while the median can move in a different direction. A separate look found that only a small share of industries were highly concentrated, and the rest split between becoming more concentrated and becoming less concentrated. Those patterns make the point plain, a market can change without becoming uniformly concentrated, and a headline number does not tell you which firms matter most.
The right habit is to read the number as a screen, not a verdict. In chemistry, that screen tells you whether a mix is likely to be too mild, too harsh, or about right for the surface in front of you. In economics, it tells you whether a market deserves a closer look, but it does not replace the rest of the evidence.
Common Mistakes and Safety Pitfalls
The fastest way to get a bad result is to treat concentration like a guess. On the chemistry side, people often overconcentrate because they think stronger is always safer. It isn't. Too much concentrate can leave residue, waste product, or create a mix that's rough on finishes, seals, or skin.
Another common mistake is reading ratio notation carelessly. 1:10 can mean one part concentrate plus nine parts water, but some labels define the total volume differently, so the outcome isn't always the same. Contact time gets skipped too, even though a weaker solution left in place long enough can outperform a stronger one rushed off the surface.
Self-audit for mixing and market reading
| Pitfall | Safer Approach |
|---|---|
| Guessing a stronger mix will clean better | Follow the stated working strength and adjust only if the label allows it |
| Treating 1:10 as if every label means the same thing | Check whether the ratio is defined as parts concentrate to parts water or to total solution |
| Ignoring dwell time | Read concentration and contact time as a pair |
| Assuming a high CR4 proves anti-competitive behavior | Check market definition, firm-size spread, and HHI |
| Comparing CR4 values across markets without context | Verify whether the market boundary and data unit match |
| Using CR4 alone because it looks simpler | Pair it with HHI when the inside shape of the market matters |
For materials work, the issue of measurement precision is explained well in measurement uncertainty in materials research, and the same caution applies when you're reading concentrations from a label or a chart. The numbers only help if the measuring method is sound. A clean workflow beats a confident guess every time.
Frequently Asked Questions
What's the difference between a chemistry concentration ratio and a market CR4?
Chemistry concentration tells you how much active ingredient sits in a solution. CR4 tells you how much of a market the top four firms control. One is about mixing liquids, the other is about market structure.
Can two industries have the same CR4 and still look very different?
Yes. If one industry's top four firms are balanced and another is dominated by one huge firm, the same CR4 can hide very different competitive pressures. That's why firm-size distribution and HHI matter.
Is a higher concentration ratio always better in chemistry?
No. A stronger mix can help with stubborn soils, but it can also create residue, stress materials, or be too harsh for delicate surfaces. The best concentration is the one that matches the job.
What's the easiest way to avoid dilution math mistakes?
Write down the starting strength, the target strength, and the final volume before you mix anything. Then keep the units the same on both sides of the equation. If the label's ratio convention is unclear, stop and confirm it before pouring.
Evo Dyne Products offers cleaning, care, and industrial fluid solutions built around the same idea this guide keeps coming back to, use the right strength for the job. If you want products that fit jewelry care, tool maintenance, and everyday household needs without turning ratio math into a headache, visit Evo Dyne Products and explore the lineup for a closer match to your task.